Reports
In Kuwaiba, reports are HTML documents designed to provide detailed information about the objects that are part of the inventory. Their purpose is to inform and follow up on specific situations. As of version 1.1, users can create their own reports using groovy scripts, usually in three steps:
- Retrieve the data: Either by performing a query directly on the database or by using the high-level API provided by Kuwaiba. In the first case, the user will have to handle the raw nodes and relationships contained in the graph database and will most likely have to use Cypher. In the second case, he will have to use the documented Java API.
- Information processing: Consists of taking the data retrieved in step 1 and performing calculations, filtering and other processing to convert it into meaningful information.
- Formatting and visualization: This consists of creating a structure of tables, labels and/or graphs to present the information in a way that is clear and easy to read.
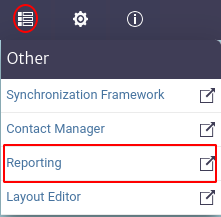
To access the reports module, locate in the menu presented at the top of the screen the Others section, represented with the list symbol ![]() . When accessing this section, a vertical menu will be displayed where you can see the
. When accessing this section, a vertical menu will be displayed where you can see the Reports module, as shown in Figure 1.
 |
|---|
| Figure 1. Access to reporting module. |
There are two types of reports: class level reports and inventory level reports. Both are explained in the following subsections.
Class Level Reports
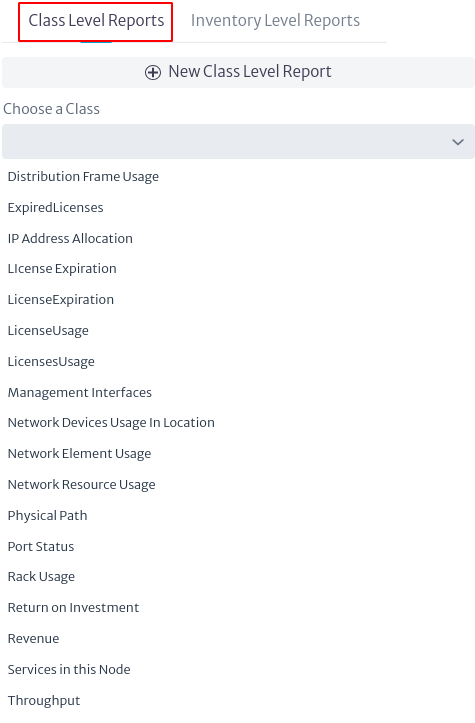
These reports are linked to the instances of a given class. From the reports module you can view the class level reports by clicking on the Class Level Reports option indicated in the red box in Figure 2, where all the existing class level reports are listed.
 |
|---|
| Figura 2. Class level reports. |
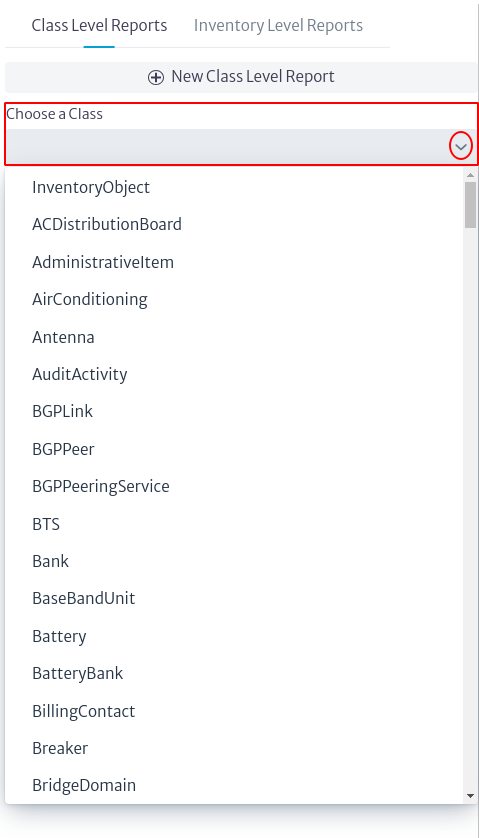
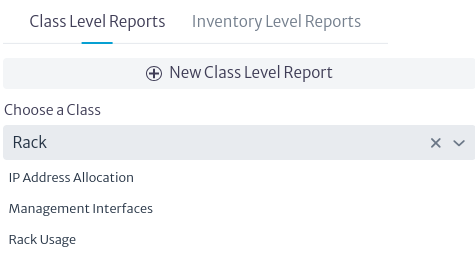
To filter the reports by class, use the search bar indicated with Choose a Class in Figure 3. Here you can view all available classes by clicking on the ![]() button and select one, either by searching directly in the drop-down list or by entering the class name. When selecting a specific class, such as
button and select one, either by searching directly in the drop-down list or by entering the class name. When selecting a specific class, such as Rack, only the reports corresponding to that class will appear, as shown in Figure 4.
 |
|---|
| Figure 3. Class selection. |
 |
|---|
| Figure 4. Reports by class. |
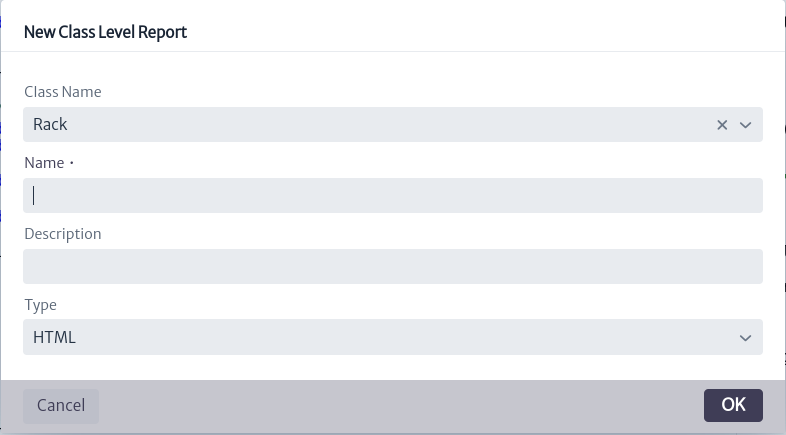
To create a new report, select the ![]() button shown in Figure 2. Clicking on this button will open a new window (Figure 5) where you can choose the class to which the report belongs, enter the name, a description and choose the type of report, which in this case is available only in HTML format.
button shown in Figure 2. Clicking on this button will open a new window (Figure 5) where you can choose the class to which the report belongs, enter the name, a description and choose the type of report, which in this case is available only in HTML format.
 |
|---|
| Figure 5. Create class level report. |
Note. If you have previously filtered the reports by class before creating a new one, when you open the creation window, the Class Name field will default to the class that was selected in the filter.
Important. In the Type field of Figure 5, when displaying the list of possible types,
CSV,
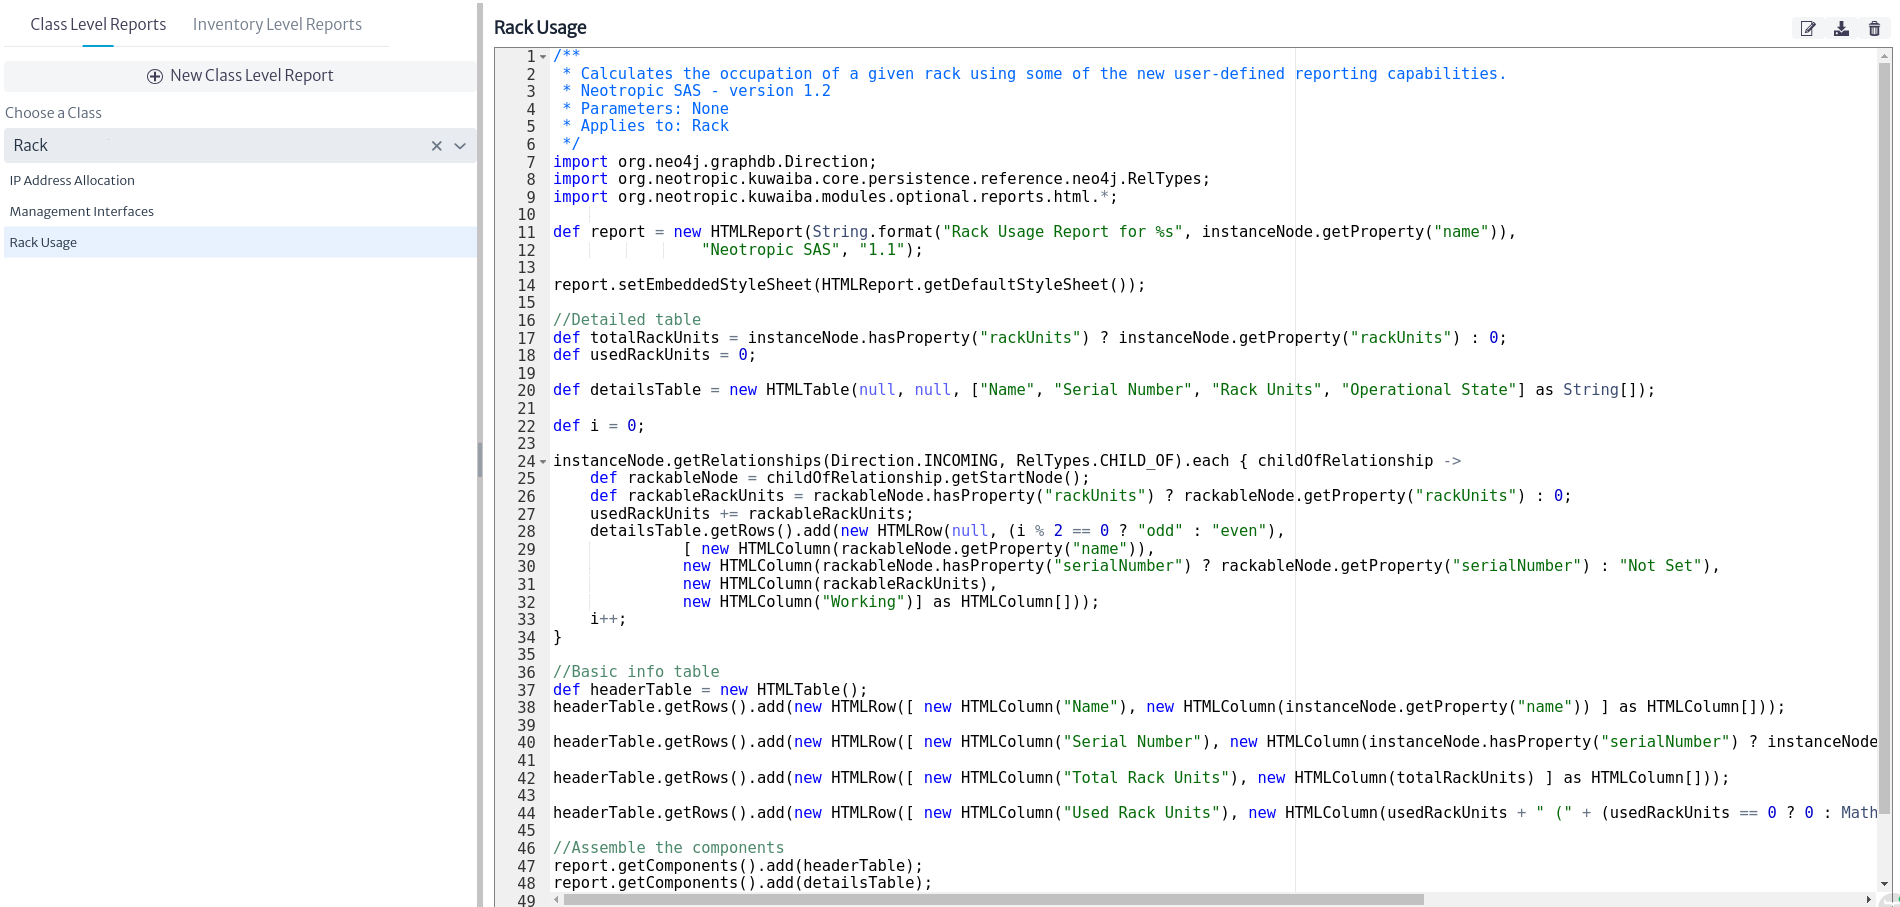
To view and modify the contents of a specific report, select it. The contents of the report are displayed on the right side of the screen, as shown in Figure 6.
 |
|---|
| Figure 6. Report content. |
The right side of Figure 6 shows the Groovy script used for the specific report, which can be edited directly from this window.
In the upper right part of Figure 6, three buttons can be seen. This image is expanded in Figure 7.
 |
|---|
| Figure 7. Report options. |
-
The icon
 allows the user to modify the properties of the selected report. Clicking on it opens a new window as shown below, where the user can change the name of the report, modify its description, and enable or disable the report.
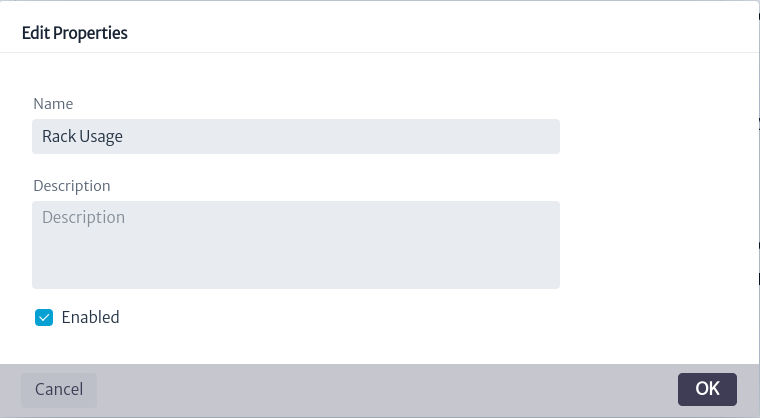
Figure 8. Edit report properties. Important. The
Enabledbutton allows you to enable or disable the report, which determines whether it can be executed or not. A report can only be run if it is enabled. When a report is created, it is enabled by default. -
The icon
 allows you to save the changes made to the script. If the user has modified the Groovy script of the report, it is necessary to select this button for the changes to be saved.
 -
The icon
 deletes a report.
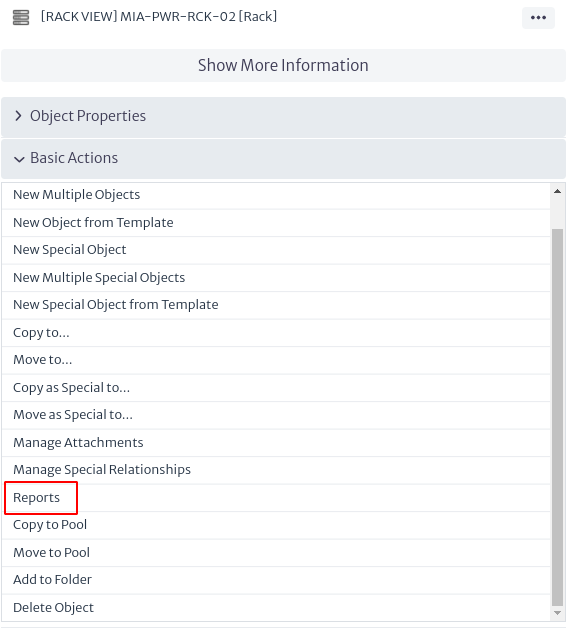
A class-level report is designed to apply to all inventory objects that belong to a specific class. To run this type of report, you can run it from any inventory object that is part of that class. For example, if we select an inventory object that belongs to the Rack class, from the Navigation module (detailed in the Navigation chapter), we search for a Rack. In the object's options panel, we find the basic actions available, where the option called Reports is included, as shown in Figure 9.
 |
|---|
| Figure 9. Reports option in the object's options panel. |
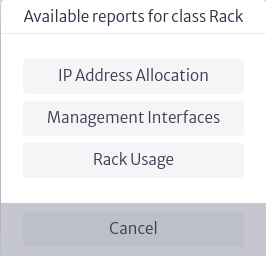
When selecting the Reports option in Figure 9, a new window appears with the reports associated to the Rack class (reports that can be executed from this object, as shown in Figure 10).
 |
|---|
| Figure 10. Available reports. |
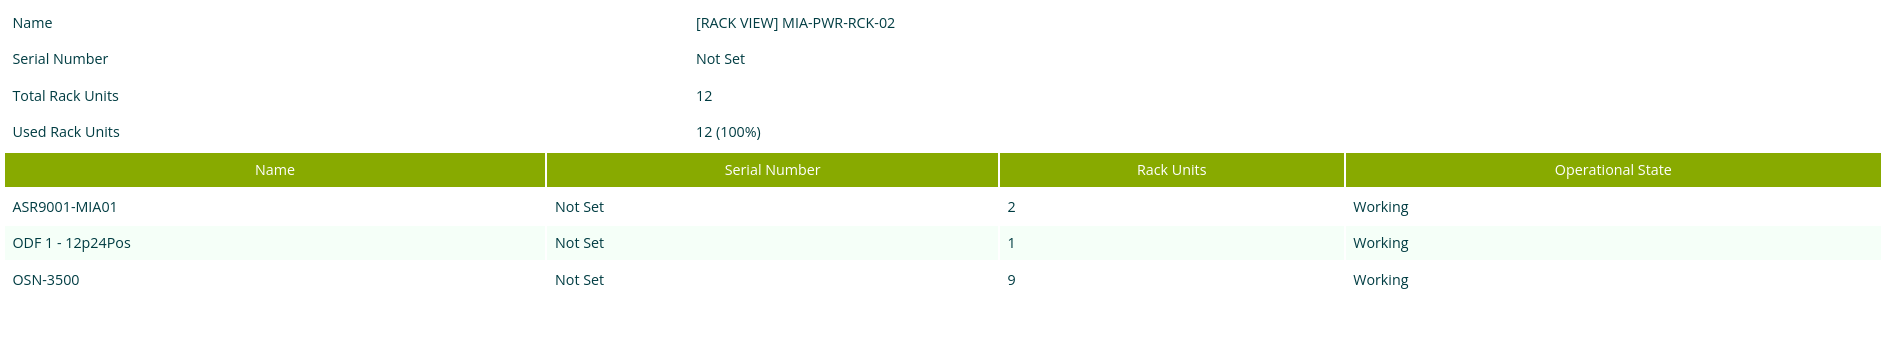
When a report is selected, a new tab opens in the browser with the HTML output of the report.
 |
|---|
| Figure 11. Report result. |
Note: Reports belonging to abstract classes are applicable to their subclasses. For example, if a report is created for the
GenericLocationclass, it will be available for its subclasses such asBuilding,House,Neighborhood, among others.
Inventory Level Reports
These reports are not linked to inventory objects. Instead, they are used to display general purpose information, such as "All support contracts about to expire" or "All inventory objects with operational status Defective". For these reports, custom parameters can be defined, unlike class-level reports that only have the object that starts the report as a parameter. Parameters are always captured as strings, and it is necessary to parse and ensure that they match the correct format at the start of the report.
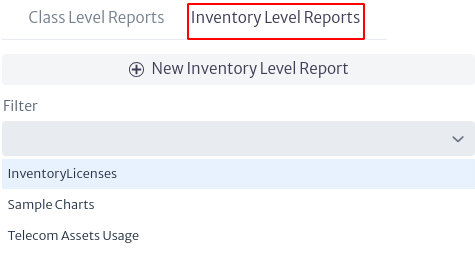
To view the existing inventory level reports, select the Inventory Levels Reports option that appears in the reports module, as shown in Figure 12. This will list all existing inventory level reports.
 |
|---|
| Figure 12. Inventory level reports. |
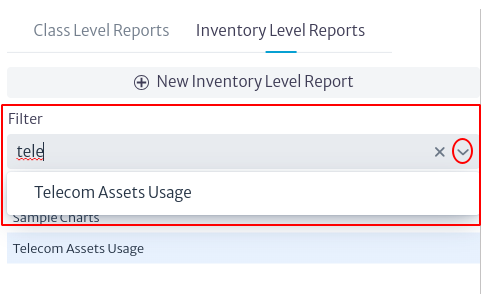
You can filter the reports by name, in case you need to search for a particular report, in the filter field shown in Figure 13. If you select the ![]() symbol, all the reports listed will appear and, as you type in the search bar, the results shown in the list will be limited to your search.
symbol, all the reports listed will appear and, as you type in the search bar, the results shown in the list will be limited to your search.
 |
|---|
| Figure 13. Inventory level report filtering. |
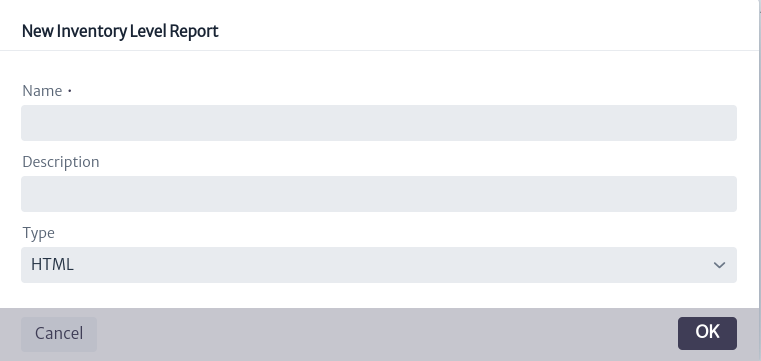
You can create inventory level reports by clicking on the ![]() button, which will open a new window where you can enter the name, a description and choose the type of report, which in this case is available only in HTML format.
button, which will open a new window where you can enter the name, a description and choose the type of report, which in this case is available only in HTML format.
 |
|---|
| Figure 14. Inventory level report filtering. |
Important. In the Type field of Figure 14, when displaying the list of possible types,
CSV,
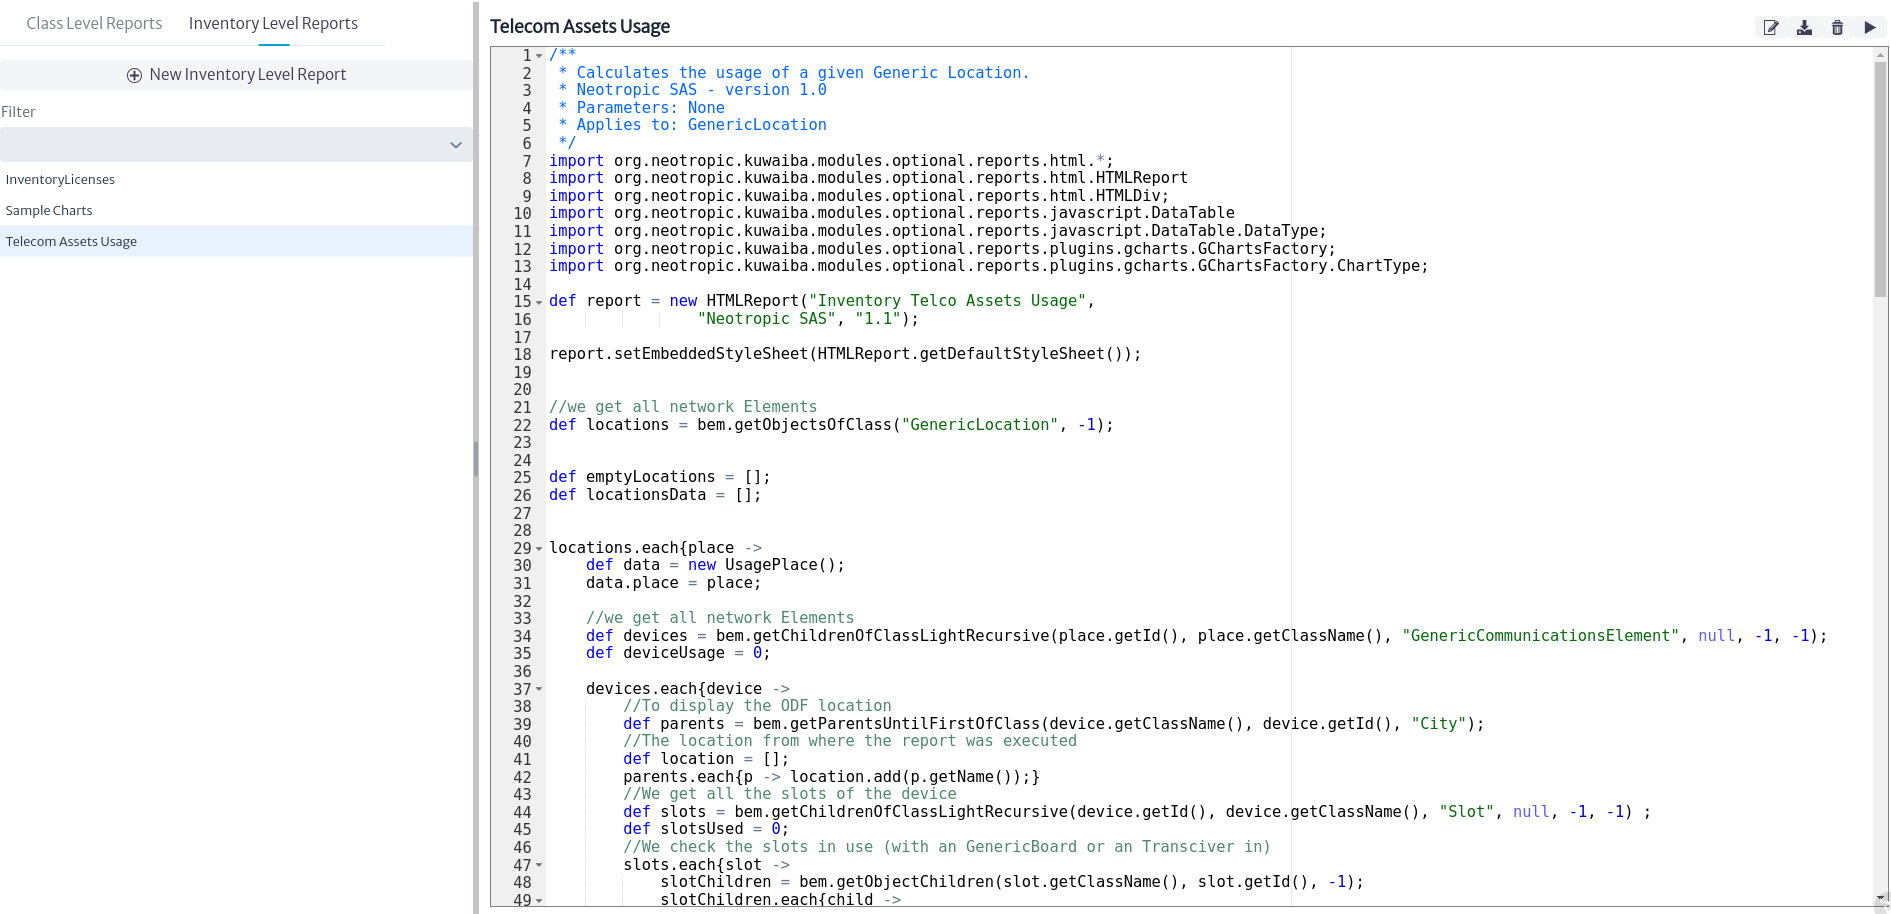
To view and modify the contents of a specific report, select it. The contents of the report are displayed on the right side of the screen, as shown in Figure 15.
 |
|---|
| Figure 15. Content of an inventory level report. |
The right side of Figure 15 shows the Groovy script used for the specific report, which can be edited directly from this window.
In the upper right part of Figure 15, there are four buttons, detailed below.
 |
|---|
| Figure 16. Inventory level reporting options. |
-
As in the previous case, the
button allows the user to modify the properties of the selected report. Clicking on it opens a new window as shown below, where the user can rename the report, modify its description, enable or disable the report and add or remove parameters.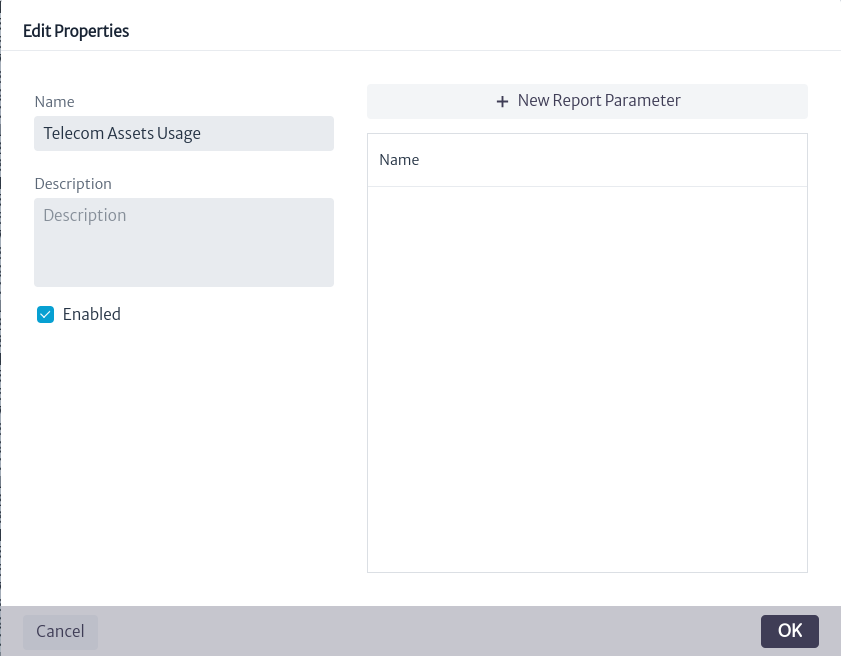
Figure 17. Edit report properties. Important. The
Enabledbutton allows you to enable or disable the report, which determines whether it can be run or not. A report can only be run if it is enabled. When a report is created, it is enabled by default. -
The
icon allows you to save the changes made to the script. If the user has modified the Groovy script of the report, it is necessary to select this button for the changes to be saved. -
The icon
deletes a report. -
The icon
 runs the report and opens a new tab in the browser with the HTML report output.
How to Create Scripts
Creating complex scripts requires some knowledge about the Persistence API and the database structure. It’s out of the scope of this document to deeply explore these topics, but this section will give you a starting point. More documentation and examples will be published in the coming releases; for now, use the reports provided in the directory scripts in the client installation bundle as reference.
-
Kuwaiba uses Groovy as scripting language. Its syntax is very similar to Java’s, but it’s optionally typed. We recommend you to use an external editor that supports Groovy syntax recognition such as Notepad++ (Windows) or GEdit (Linux/MacOS) to write your scripts, then copy the text to the corresponding field in the report properties.
-
All scripts must return an HTMLReport object. This class and the others that are used to build the report are located in the package org.neotropic.kuwaiba.modules.optional.reports.html. There are wrappers for the most common HTML tags, and constructing a report consists of nesting instances of these classes in the right order.
-
The following variables are injected in the script and can be used at any moment:
Variable Name Type Note instanceNode Neo4jNode Only applicable to class level reports. It’s the node in the database that holds the information of the object that triggered the report. graphDb Neo4j GraphDatabase The reference to the connection handler. This gives complete access to the database. Use with caution. className String Only applicable to class level reports. The class of the object that triggered the report. objectId Long Only applicable to class level reports. The id of the object that triggered the report. parameters HashMap[String, String] Only applicable to inventory level reports. The list of parameters provided during the execution of the report. -
There are some built-in reports that could serve as reference on how to retrieve and manipulate the information from the database. They are a temporary solution and will be converted to actual scripts in future releases, but they can help you get started on how to use the Persistence API.
-
Sample Reports can be found in https://sourceforge.net/p/kuwaiba/code/HEAD/tree/server/trunk/scripts/reports/, where report-related scripts have the prefix
RPin their name.
Basic Concepts
To create a report, it's important to understand how they work. Reports are built modularly by adding HTML tags, each of which displays information and applies its own logic
To build a report, the first step is to create the instance
def report = new HTMLReport(String.format("Report's name","", "1.0"))
Next step is choose an HTML tag to display information, the options are:
-
Text: Text is an HTML tag where is possible show a information, error or warning message. To create a message is:
def message = new HTMLMessage(cssAttributes, null, text)If want to add a variable in message use String.format(), for example:
def message = new HTMLMessage(cssAttributes, null, String.format("put your text %s",variable))Where: cssAttributes represents the ccs styles applied to the text separated by semicolons(;), for example:
def cssAttributes = "color:black; font-weight: normal; font-size: 2em " -
Table: Table is an HTML tag where is possible show a information in format table with rows and columns. To create a table is
def table = new HTMLMTable()To add values to table use the method
table.getRows().add(), but are two possibilities when the number of rows is known: the table is created by defining the name of the columns and the value of the row at the same time.In the case when the number of rows is known, the table is created by defining the name of the columns and the value of the row at the same time. For example:
generalInfoTable.getRows().add(
  new HTMLRow(cssAttribute, null,
      [
          new HTMLColumn(cssAttribute, null, text),
          new HTMLColumn(value)
      ] as HTMLColumn[]));
Note
- The first new HTMLColumn represent the name of column and new HTMLColumn is the value
- It is mandatory to cast the content to HTMLColumn
- cssAttributes represents the ccs styles applied
When the number of rows is not known, first define the name of the columns:
table = new HTMLTable(null, null, ["COLUMN1", "COLUMN2", "COLUMN3"] as String[])Note:
- It is mandatory to cast the content to String
After, add row's value:
table.getRows().add(
  new HTMLRow(null, null,
      [
        new HTMLColumn(cssattributes,null,value)
      ] as HTMLColumn[]));
Note
- The first new HTMLColumn represent the name of column and new HTMLColumn is the value
- It is mandatory to cast the content to HTMLColumn
- cssAttributes represents the ccs styles applied
Charts: Charts are an HTML element that allow you to visualize data using pie, line, or column graphs. These charts are created from the data stored in a data table, so it's essential to create the table first.
def dataTable = new DataTable([DataType.STRING, DataType.NUMBER ] as DataType[], ["COLUMN1", "COLUMN2"] as String[])
Note
It is mandatory to cast the content to DataType
To add values to the datatable, the column correspond the name of the column and value is the number:
dataTable.addRow(["COLUMN", value] as String[])
Note
It is mandatory to cast the content to String
To create the chart, it is necessary use the GChartsFactory
def chartsFactory = new GChartsFactory(report)
def htmlDivPieChart = chartsFactory.createHTMLDivWrapperChart(ChartType.PIECHART, "divPieChart", name , dataTable);
Notes
- It posible change the styles of htmlDivPieChart using :
htmlDivPieChart.setStyle("cssStyle").- Is possible use types of chart: ChartType.PIECHART, ChartType.COLUMNCHART and ChartType.LINECHART.
Finally step is add the HMTL tag's to report and return it:
report.getComponents().add(HMTLTag)
return report
After choosing the HTML tag to display a text, you must query the inventory information to display. There are two ways to query the information: use Cypher to query directly in Ne4oj or use the Persistence API.
The Persistence API is extensive and contains many methods; however, the most commonly used ones are listed below.
| Methods | Description | Return |
|---|---|---|
| getAttributeValueAsString( classObject, IdObject, NameAttributes ) | Returns the value as string of an attribute | String |
| getSpecialAttribute( classObject, IdObject , nameRelantionship ) | Returns relationship of given object | BusinessObjectLight |
| getObject( classObject, IdObject ) | Returns the given object | BusinessObject |
| getParent( classObject, IdObject) | Returns the object's parent | BusinessObjectLight |
| getObjectChildren( classObject, IdObject, -1) | Returns the children of given object | BusinessObjectLight |
| getObjectsOfClassLight(classToFind, null, -1, -1) | Returns all objects belong a class | BusinessObjectLight |
Note
- Business Object refers a object with all attributes meanwhile Business Object Light refers a object with only attributes: class name, object id and nam
- If the object is a Business Object, it is possible to get any of its attributes:
object.getAttributes().get(attributeName)
- If the object is a Business Object Light, only get the following attributes:
objectLight.getName()
objectLight.getClassName()
objectLight.getId()
Learning By Example
Case 1
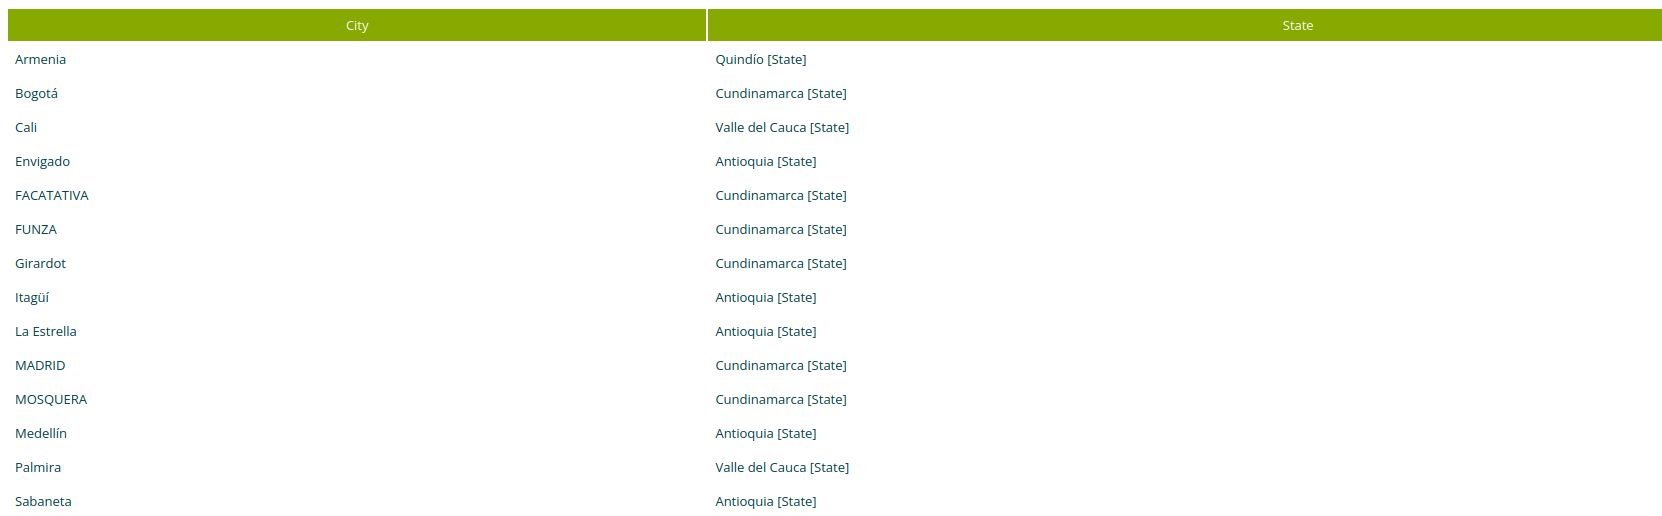
Example showing in a table the cities in the inventory and to which state they belong
-
Create the inventory report in the module of report as show in Figure 14
-
Import the module
import org.neotropic.kuwaiba.modules.optional.reports.html.*
- Define the name and CSS style of report
def report = new HTMLReport("Cities in inventory" , "Neotropic SAS", "1.0")
report.setEmbeddedStyleSheet(HTMLReport.getDefaultStyleSheet())
- Use the method getObjectsOfClassLight to search the all cities in the Inventory and save in a variable
def cities = bem.getObjectsOfClassLight("City", null, -1, -1)
- Create the table with the column name
def citiesTable = new HTMLTable(null, null, ["City","State"] as String[])
- Go through all the cities in the array and query each one for her parent
cities.each { city ->
    def state = bem.getParent( city.getClassName(), city.getId()))
- Add to table the data
citiesTable.getRows().add(new HTMLRow([
        new HTMLColumn( city.getName()),
        new HTMLColumn(counrty),
    ] as HTMLColumn[]))
}
- Add the table to report and return it
report.getComponents().add(citiesTable)
return report
9.The report must look like this
import org.neotropic.kuwaiba.modules.optional.reports.html.*

def report = new HTMLReport("City in inventory" , "Neotropic SAS", "1.0")
report.setEmbeddedStyleSheet(HTMLReport.getDefaultStyleSheet())

def cities = bem.getObjectsOfClassLight("City", null, -1, -1)
def citiesTable = new HTMLTable(null, null, ["City","State"] as String[])

cities.each { city ->
    def state = bem.getParent( city.getClassName(), city.getId())

    citiesTable.getRows().add(new HTMLRow([
        new HTMLColumn( city.getName()),
        new HTMLColumn(state),
    ] as HTMLColumn[]))
}

report.getComponents().add(citiesTable)
return report
- The result of the report will be
 |
|---|
| Figure 17. Report Result |
Case 2
For this example, a title is added to case 1
- Create a message
def title = new HTMLMessage("color:black; font-weight: normal; font-size: 2em; ", null, String.format("Cities in Inventory"))
Note
In this case the css style are set as string
- Create a div containing the title
def divTitle = new HTMLDiv("div",title)
Note
It is possible to set css styles to the div,
divTitle.setStyle("width: 100vw;display: flex; justify-content: center; align-items: center;padding:4px")
- Add div to report
report.getComponents().add(divTitle)
- The report must look like this
import org.neotropic.kuwaiba.modules.optional.reports.html.*

def report = new HTMLReport("Cities in Inventory" , "Neotropic SAS", "1.0")
report.setEmbeddedStyleSheet(HTMLReport.getDefaultStyleSheet())

def cities = bem.getObjectsOfClassLight("City", null, -1, -1)
def citiesTable = new HTMLTable(null, null, ["City","State"] as String[])

cities.each { city ->
    def state = bem.getParent( city.getClassName(), city.getId())

    citiesTable.getRows().add(new HTMLRow([
        new HTMLColumn( city.getName()),
        new HTMLColumn(state),
    ] as HTMLColumn[]))
}
def title = new HTMLMessage("color:black; font-weight: normal; font-size: 2em; ", null, String.format("Cities in Inventory"))
def divTitle = new HTMLDiv("div",title)
divTitle.setStyle("width: 100vw;display: flex; justify-content: center; align-items: center;padding:4px")

report.getComponents().add(divTitle)
report.getComponents().add(citiesTable)
return report
- The result of the report will be
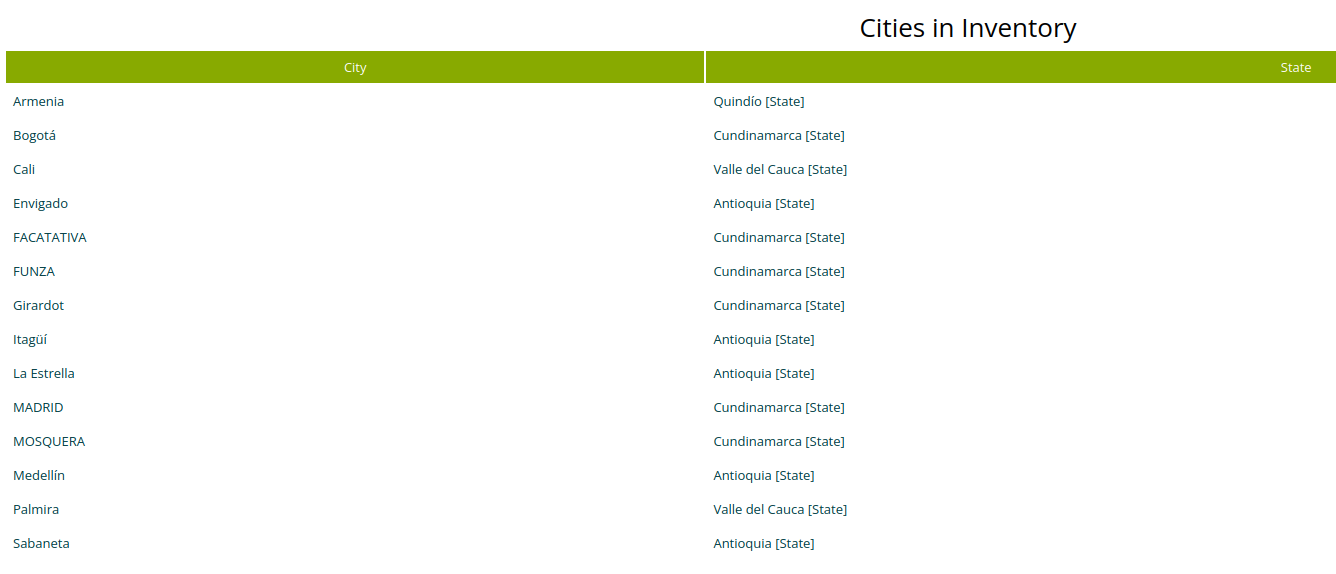 |
|---|
| Figure 18. Title Report Result |
Case 3
For this case, a bar chart is added to case 2 where the number of cities per state is displayed.
- Add the imports
import org.neotropic.kuwaiba.modules.optional.reports.javascript.DataTable
import org.neotropic.kuwaiba.modules.optional.reports.javascript.DataTable.DataType
import org.neotropic.kuwaiba.modules.optional.reports.plugins.gcharts.GChartsFactory
import org.neotropic.kuwaiba.modules.optional.reports.plugins.gcharts.GChartsFactory.ChartType
- Create the dataTable
def dataTable = new DataTable([DataType.STRING, DataType.NUMBER ] as DataType[], ["State", "Cities Number"] as String[])
- Define the variables where the number of cities per state is stored
def quindio = 0
def antioquia = 0
def valleCauca = 0
def cundinamarca = 0
- Implement the logic to check how many cities there are per state
 switch(state.getName()) {
        case "Antioquia":
            antioquia++
            break
        case "Quindío":
            quindio++
            break
        case "Cundinamarca":
            cundinamarca++
            break
         case "Valle del Cauca":
            valleCauca++
            break
        default:
            break
    }
- Add the value rows to dataTable
dataTable.addRow(["Antioquia",antioquia] as String[])
dataTable.addRow(["Quindio",quindio] as String[])
dataTable.addRow(["Cundinamarca",cundinamarca] as String[])
dataTable.addRow(["Valle del Cauca",valleCauca] as String[])
- Create the chartsFactory
def chartsFactory = new GChartsFactory(report)
- Generate the bar chart
def htmlDivColumnChart = chartsFactory.createHTMLDivWrapperChart(ChartType.COLUMNCHART, "divColumnChart", "Bar Chart Cities Per State", dataTable);
- Add the chart to report
report.getComponents().add(htmlDivColumnChart)
- The final code is
import org.neotropic.kuwaiba.modules.optional.reports.html.*
import org.neotropic.kuwaiba.modules.optional.reports.javascript.DataTable
import org.neotropic.kuwaiba.modules.optional.reports.javascript.DataTable.DataType
import org.neotropic.kuwaiba.modules.optional.reports.plugins.gcharts.GChartsFactory
import org.neotropic.kuwaiba.modules.optional.reports.plugins.gcharts.GChartsFactory.ChartType;

def report = new HTMLReport("Cities in Inventory" , "Neotropic SAS", "1.0")
report.setEmbeddedStyleSheet(HTMLReport.getDefaultStyleSheet())

def cities = bem.getObjectsOfClassLight("City", null, -1, -1)
def citiesTable = new HTMLTable(null, null, ["City", "State"] as String[])

def dataTable = new DataTable([DataType.STRING, DataType.NUMBER ] as DataType[], ["State", "Cities Number"] as String[])

def quindio = 0
def antioquia = 0
def valleCauca = 0
def cundinamarca = 0

cities.each { city ->
    def state = bem.getParent( city.getClassName(), city.getId())

    switch(state.getName()) {
        case "Antioquia":
            antioquia++
            break
        case "Quindío":
            quindio++
            break
        case "Cundinamarca":
            cundinamarca++
            break
         case "Valle del Cauca":
            valleCauca++
            break
        default:
            break
    }


    citiesTable.getRows().add(new HTMLRow([
        new HTMLColumn( city.getName()),
        new HTMLColumn(state),
    ] as HTMLColumn[]))
}

dataTable.addRow(["Antioquia", antioquia] as String[])
dataTable.addRow(["Quindio", quindio] as String[])
dataTable.addRow(["Cundinamarca", cundinamarca] as String[])
dataTable.addRow(["Valle del Cauca", valleCauca] as String[])

def chartsFactory = new GChartsFactory(report)
def htmlDivColumnChart = chartsFactory.createHTMLDivWrapperChart(ChartType.COLUMNCHART, "divColumnChart", "Bar chart Cities Per State", dataTable);

def title = new HTMLMessage("color:black; font-weight: normal; font-size: 2em; ", null, String.format("Cities in Inventory"))
def divTitle = new HTMLDiv("div",title)
divTitle.setStyle("width: 100vw;display: flex; justify-content: center; align-items: center;padding:4px")

report.getComponents().add(divTitle)
report.getComponents().add(citiesTable)
report.getComponents().add(htmlDivColumnChart)


return report
- The result is
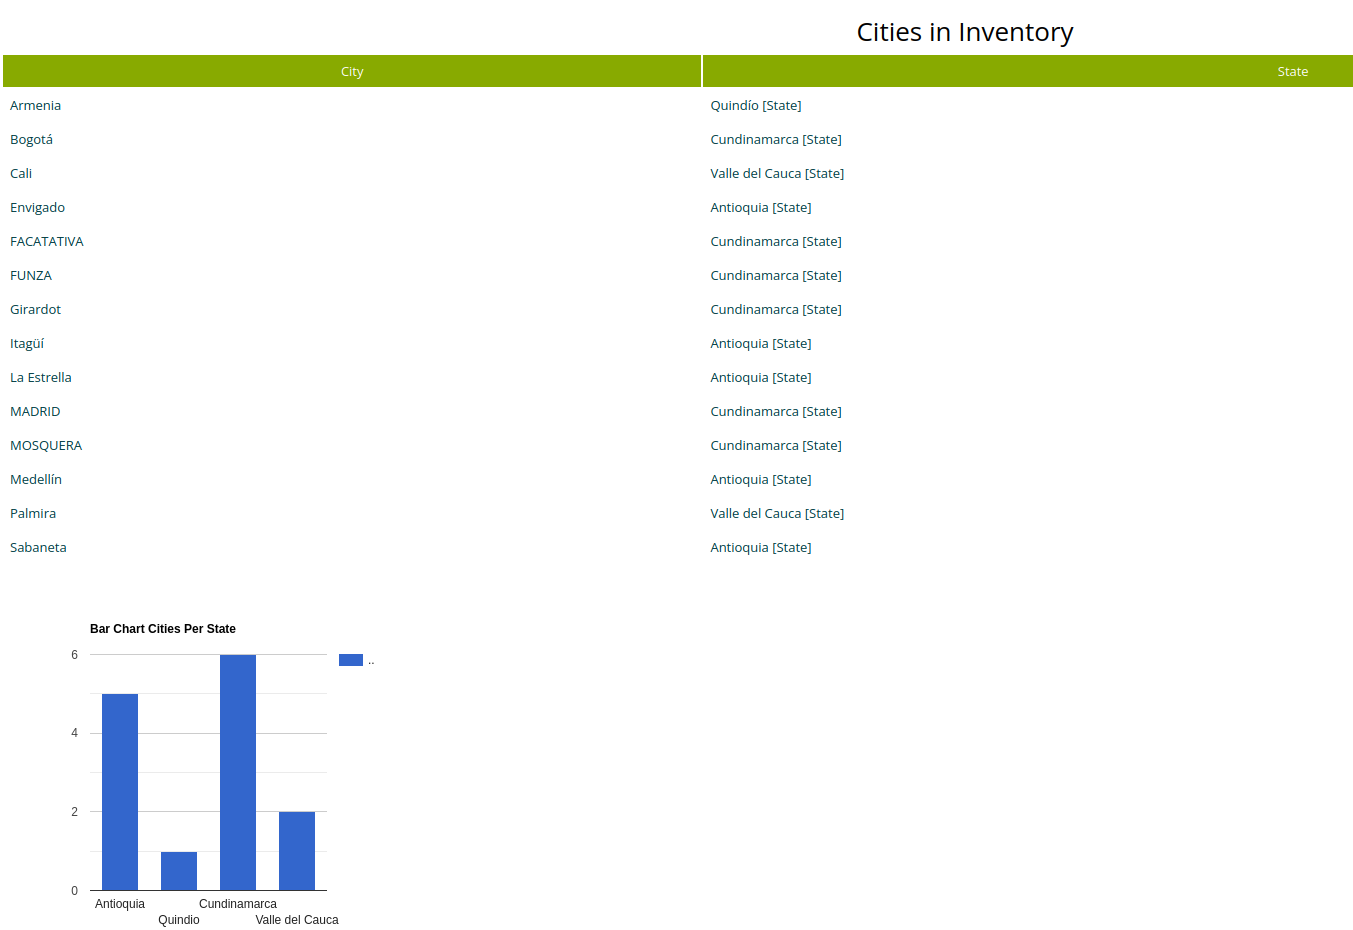 |
|---|
| Figure 19. Report With Column Chart |